Bowtie Diagram Examples: Building a Diagram Step-By-Step
Welcome to our guide on creating a bowtie diagram, a powerful risk assessment tool. If you’re not familiar with a bowtie diagram or the terminology, you may get a little lost. Head over to our blog, “7 Elements of a Bowtie Diagram” if that’s the case. In this blog, we’ll walk you through the steps to create a bowtie diagram, and we’ll build one together. For our example, we’ll assess the risks at… Dinosaur Park! A thrilling new visitor attraction that’s recently opened.
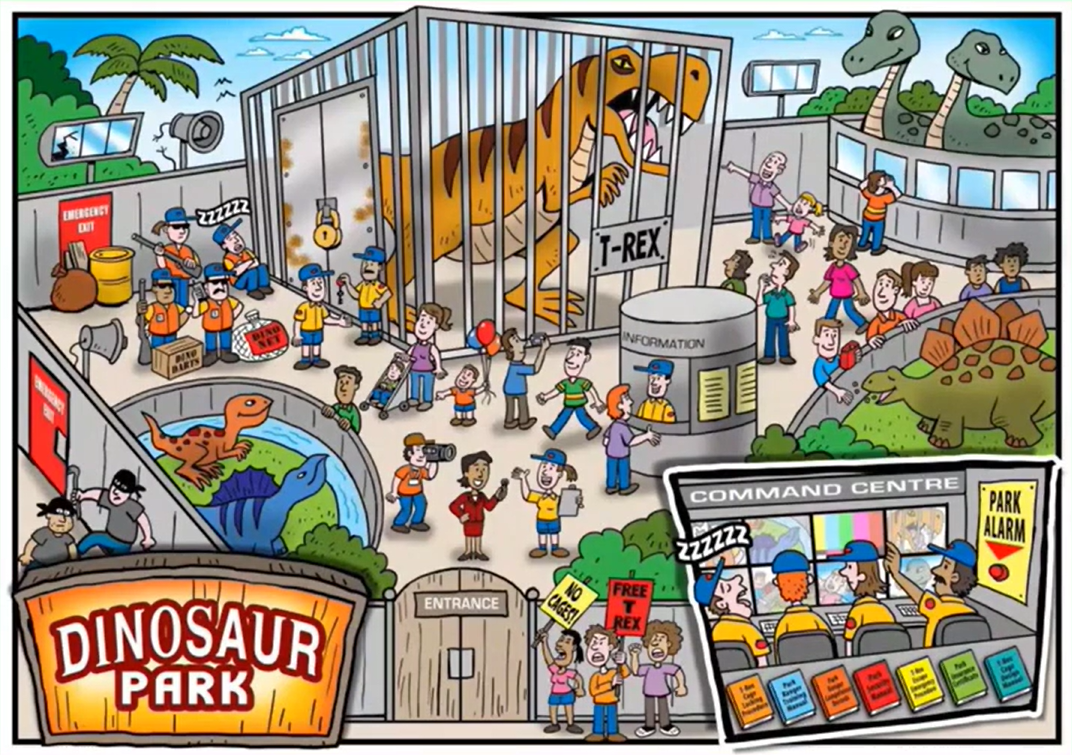
Dinosaur Park features a mighty T-Rex, a perimeter wall, a command centre, various manuals, and visitors. While it might seem exciting, we’re here to identify potential hazards that could lead to unwanted incidents. Take a look at the image below to see if you can spot any lurking dangers.
Now let’s get into the five key steps to creating a bowtie diagram.
Step 1: Establish Potential Risk
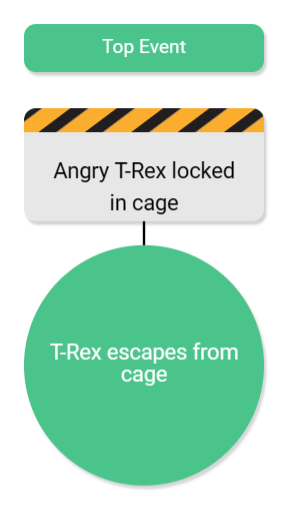
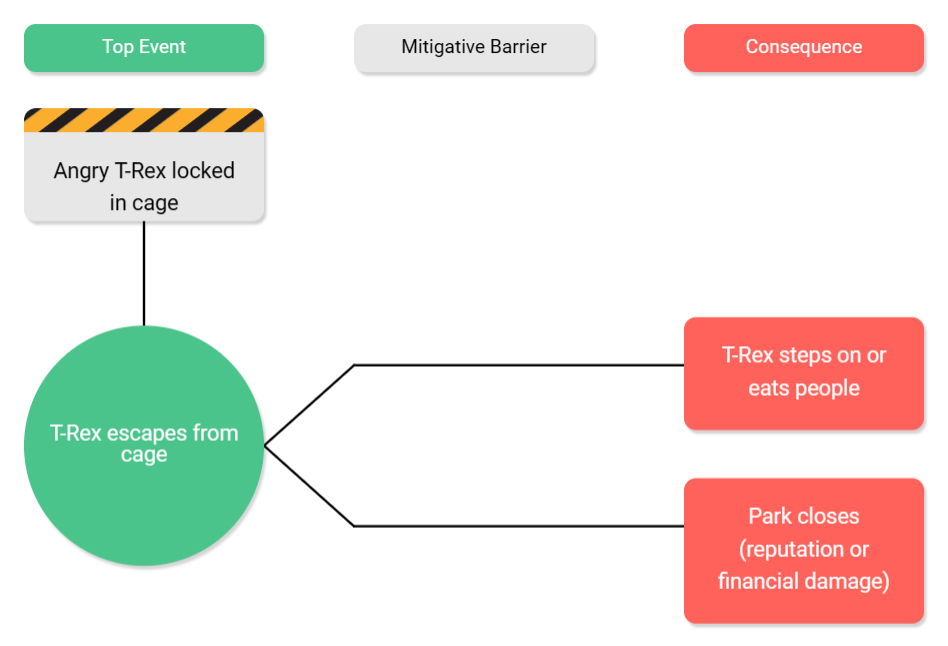
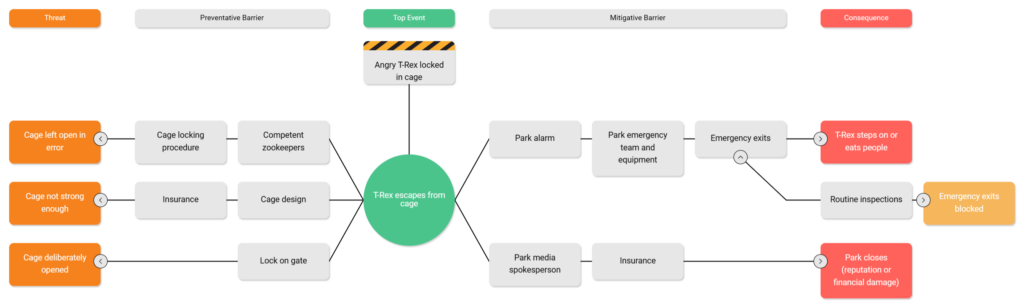
Our first step is to establish potential risks. We start with what’s called the hazard. The hazard is something that could cause harm to people, equipment, the park’s reputation, etc. In our case, it’s the “Angry T-Rex locked in a cage.” Make sure to provide context about its controlled state, situation, or size, ensuring that the audience understands its nature. Simply “T-Rex” would be too broad.
We then add the top event. This is the point at which control over the hazard is lost. So for our example, our top event is “T-Rex escapes from cage”. This is one of the most crucial points of the exercise to get right. The top event shouldn’t be a consequence, because at this moment, nothing bad has happened yet. It shouldn’t be too narrow such that there is only a single consequence or indeed too wide a bearing that there are dozens of consequences that may stem from the incident.
It is also possible for a hazard to have multiple top events – for example, the T-Rex could also start aggravating other dinosaurs in the park. Each bowtie diagram has just one top event, so a second would require another diagram.
Step 2: What Are the Consequences?
Now that we’ve established our top event as “Angry T-Rex escapes from cage,” it’s time to think about the consequences. These are the potential harms or damages that could result from this top event. Remember, a top event can have many consequences. While we often focus on the major ones, don’t forget to consider all possible outcomes.
It’s crucial to provide enough context when describing these consequences. Terms like “injury” or “damage” may not always offer sufficient detail. However, getting too specific can lead to unnecessary splitting of similar consequences. For example, whether you are stepped on by our beloved t-rex, or eaten, it doesn’t really matter – it’s ultimately the same consequence.
Step 3: What Are the Threats?
At this point, we’ve covered the top event and its potential consequences. The next critical element is identifying the threats. These are the factors that could lead to a loss of control over the hazard, thus triggering the top event and resulting in undesired consequences.
Identifying all potential threats is essential, and can often be more difficult than identifying consequences. For this reason, it’s often done through brainstorming sessions where team members share their insights. Just like with consequences, it’s important to provide ample context when describing threats. Your audience should clearly understand how each threat could directly cause the top event.
Threats can originate from various sources – they can be failures, external influences, or operational issues. For example, in our scenario:
- The cage may be left open in error by the park rangers.
- The cage itself might not be strong enough to contain the T-Rex.
- The cage could be deliberately opened by some of the suspicious characters.
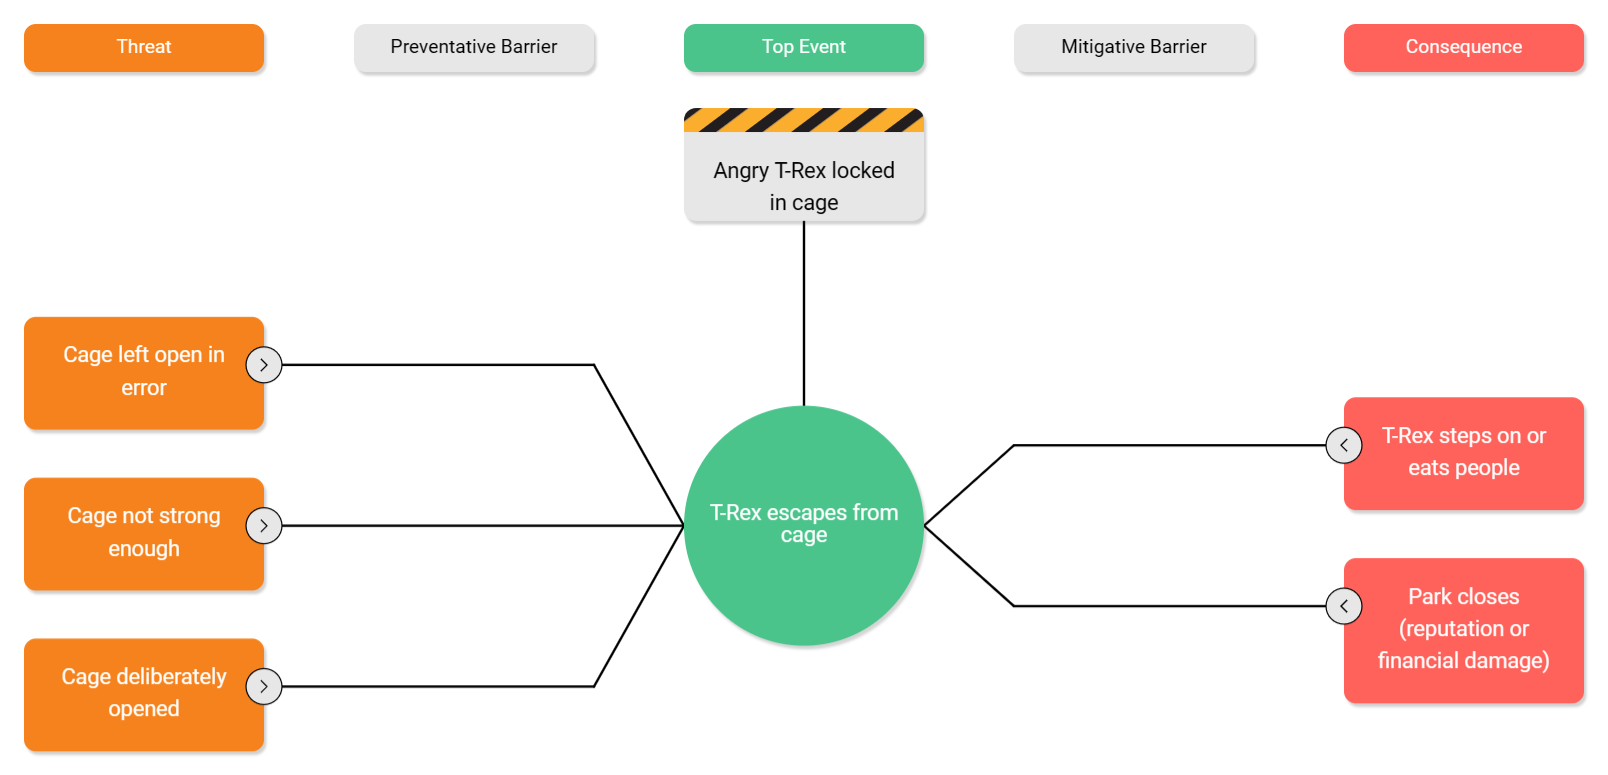
Now we can really start to see the bowtie diagram start to take shape! Let’s move onto step 4…
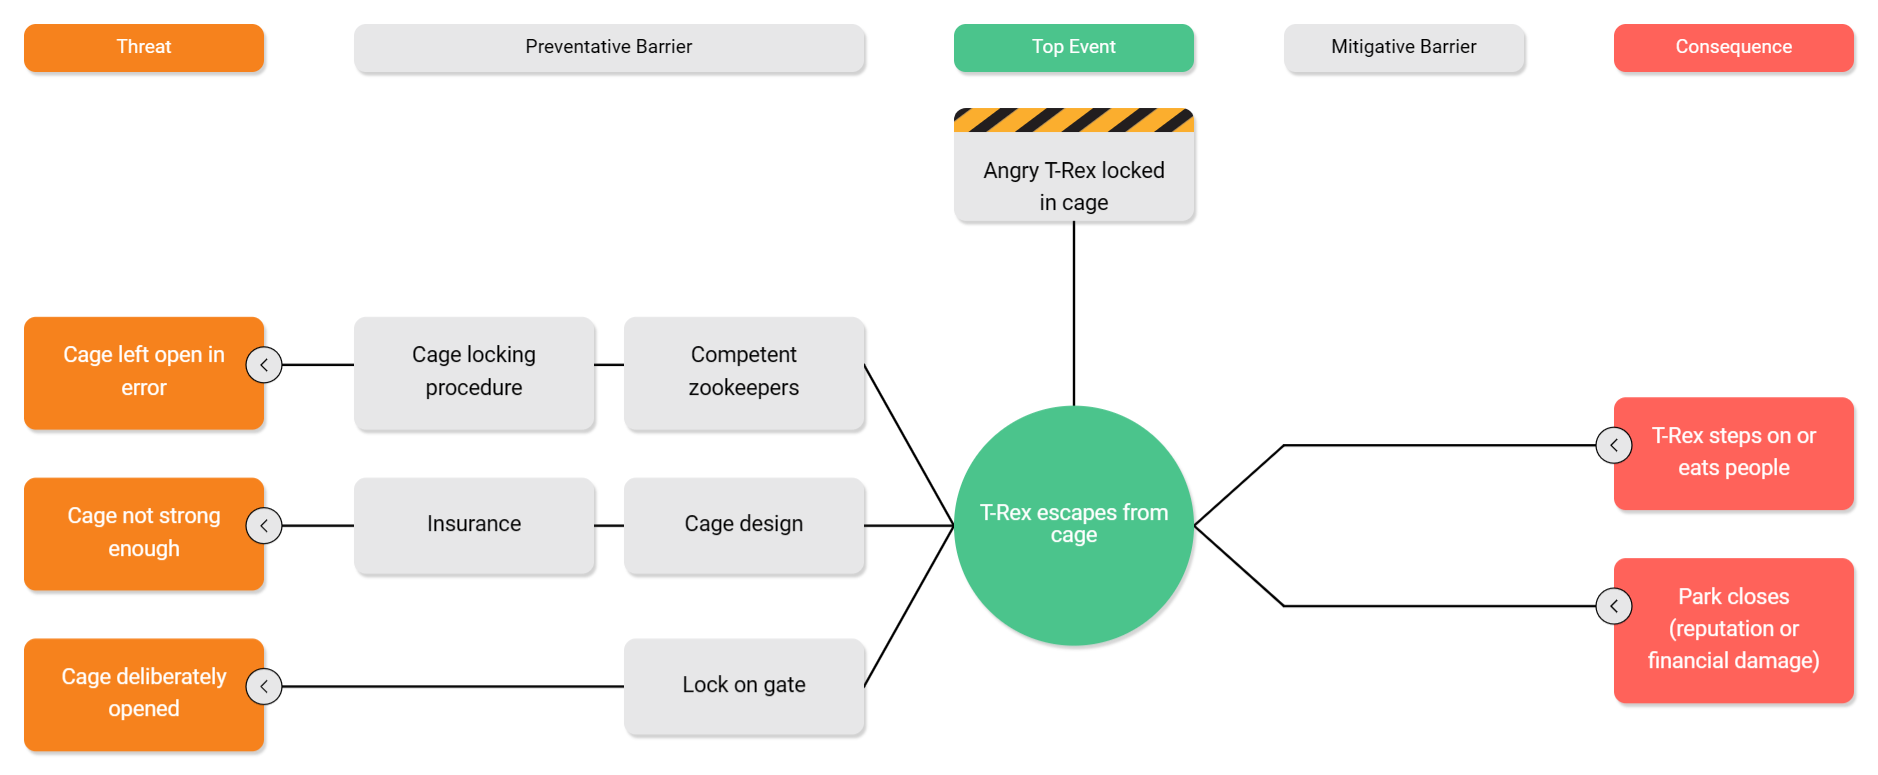
Step 4: Add Barriers (Preventative)
Now, let’s move on to step four, where we introduce barriers on the left hand side of the bowtie, designed to prevent the top event. They’re like the gatekeepers of safety, standing guard.
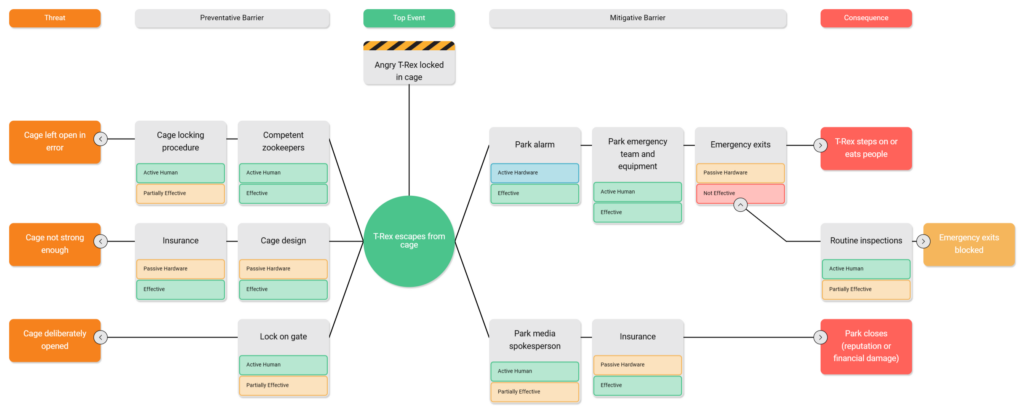
Let’s zoom out for a second. When describing barriers in general, it’s essential to do so correctly. Barriers should meet three criteria: they must be effective, independent, and auditable. This means that each barrier should be capable of effectively blocking the top event on its own, not reliant on other factors. Barriers can take many forms, from passive ones like walls to active ones like detectors or alarms. They can be hardware, software, or human-based, and some might even involve procedures.
In our Dinosaur Park scenario, we might have preventative barriers like “Cage Design,” “Cage Locking Procedure,” “Competent Zookeepers,” and “Lock on Gate.”
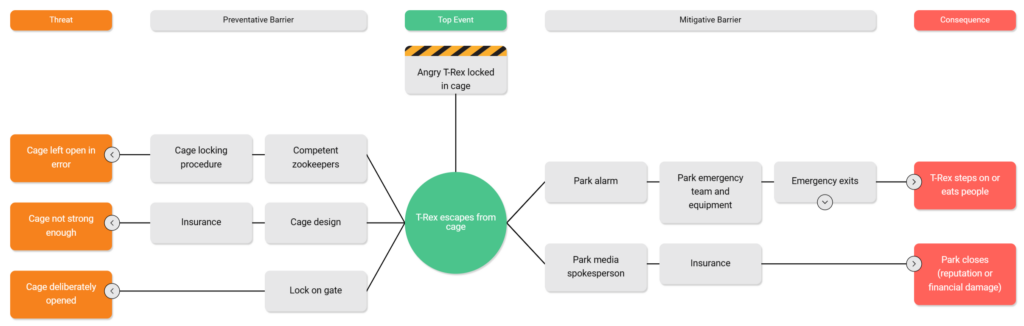
Step 5: Add Barriers (Mitigative)
In step five, we look at mitigative barriers on the right hand side of the diagram, those that come into play after the top event. These barriers are designed to prevent or minimise the consequences of the top event, like a backup plan to limit the damage. If our preventative barriers are successful in stopping the top event, the mitigative barriers won’t need to be deployed.
So, in our Dinosaur Park case, we could have barriers such as the “Park Alarm,” “Park Emergency Team,” “Emergency Exits,” “Security Team Equipment,” “Park Media Spokesperson,” and “Insurance.” With all these barriers in place, we’re better equipped to handle any situation and ensure the safety of our visitors.
Now we’ve got a real bowtie diagram on our hands! And while you may be tempted to stop there, these next two steps are what can take your bowtie diagram to the next level. Starting with…
Step 6: Add Degradation factors and controls
What’s a degradation factor I hear you ask? Well, they are conditions or situations that can compromise the effectiveness of a barrier. Use them sparingly though, and keep them to representing only the most significant threats to barrier integrity. So let’s take our dinosaur park example. A degradation factor could be “emergency exits blocked” – which is now compromising the effectiveness of the barrier “emergency exits.”
But don’t worry – degradation factors have controls that can prevent them from weakening the barrier. Sticking with our example, a degradation control could be “routine inspections of emergency exits,” to make sure they remain clear.
Step 7: Metadata
For those who don’t know, metadata is just a word that basically means ‘information… about information’. Think of ‘tags’ that you might add to a social media post. So, let’s tag our diagram elements – in particular, your barriers – with relevant details about its health, owner, type, performance standard, and more.
This way, readers of the diagram will have enough context to gain a clear picture of risk, without having to ask loads of questions. Remember, the diagram’s aim is to communicate a complete picture of the risks, and metadata will fill in any of those gaps.
Where can you create a bowtie diagram?
When it comes to designing your diagram, there are various tools available. You can use our PowerPoint and Excel templates, which are free to download. To build our example above, we’ve been using Bowtie Master. It’s easy to use, and we’d be happy to set you up on a free trial after a quick product tour with our team. Click this link to book.